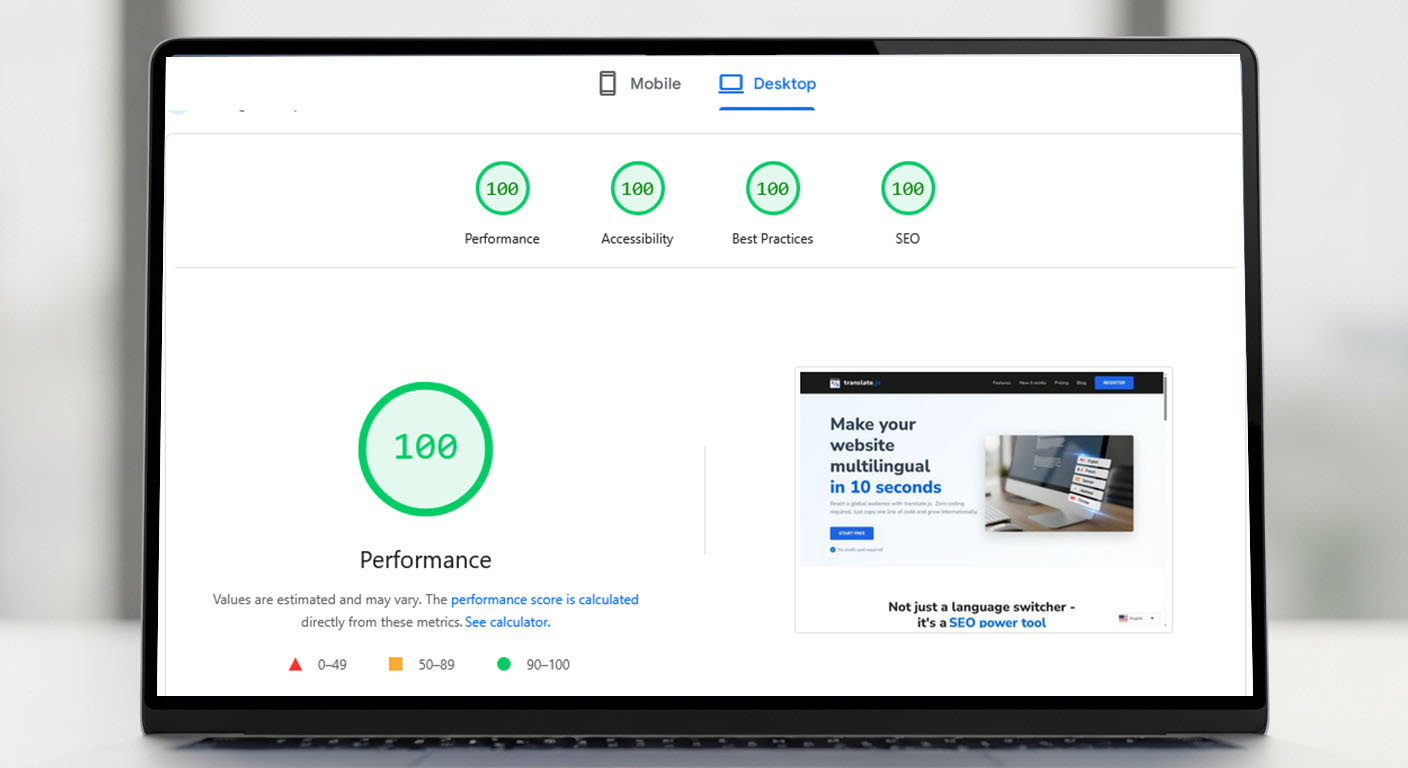
Jeśli prowadzisz stronę internetową, prawdopodobnie słyszałeś o Google PageSpeed Insights. Jest to bezpłatne narzędzie firmy Google, które mierzy wydajność Twoich stron internetowych zarówno na urządzeniach mobilnych, jak i stacjonarnych. Jednak uzyskanie wysokiego wyniku często może wydawać się grą, której nie można wygrać.
Dzisiaj przeprowadzimy szczegółowy przegląd PageSpeed Insights, przyjrzymy się wszystkim możliwym problemom, które obniżają Twój wynik i dokładnie wyjaśnimy, jak zoptymalizować Twoją witrynę.
Dlaczego szybkość witryny jest tak ważna?
Zanim przyjrzymy się problemom technicznym, porozmawiajmy o tym, dlaczego powinno Cię to obchodzić. Prędkość witryny to nie tylko wskaźnik próżności. Ma to bezpośredni wpływ na Twoją firmę.
Po pierwsze, szybkość jest głównym czynnikiem rankingowym SEO. Google oficjalnie oświadczyło, że korzysta z Core Web Vitals, aby decydować o wysokiej pozycji Twoich stron. Jeśli ładowanie Twojej witryny trwa zbyt długo, Google przesunie Cię w dół wyników wyszukiwania.
Po drugie, prędkość wpływa na komfort użytkowania i współczynniki konwersji. Większość użytkowników porzuci stronę, jeśli jej pojawienie się zajmie więcej niż trzy sekundy. Szybka witryna utrzymuje zaangażowanie odwiedzających i sprawia, że znacznie zwiększają oni prawdopodobieństwo zakupu Twojego produktu lub przeczytania Twoich artykułów.
Zrozumienie metryk PageSpeed Insights
Po wpisaniu adresu URL w PageSpeed Insights otrzymasz dwa typy danych: dane laboratoryjne i dane terenowe.
Dane terenowe pokazują, jak prawdziwi użytkownicy postrzegają Twoją witrynę. Dane te są gromadzone przez 28 dni przy użyciu raportu Chrome User Experience Report (CrUX). To jest to, co naprawdę ma znaczenie dla Twojego SEO. Dane laboratoryjne są gromadzone w kontrolowanym środowisku, aby pomóc Ci debugować problemy.
Główne wskaźniki, na które należy zwrócić uwagę to:
- Pierwsza farba treściwa (FCP): czas potrzebny przeglądarce na wyrenderowanie pierwszego fragmentu tekstu lub obrazu.
- Największa farba treściwa (LCP):czas potrzebny do uwidocznienia największego bloku treści.
- Skumulowana zmiana układu (CLS): mierzy, jak bardzo układ strony zmienia się podczas ładowania.
- Interakcja z następną farbą (INP): jak szybko Twoja strona reaguje po kliknięciu lub dotknięciu czegoś przez użytkownika.
Typowe problemy, które psują Twój wynik
Uzyskanie złego wyniku jest łatwe. Aby to naprawić, trzeba znaleźć przyczynę problemu. Oto najczęstsze problemy, które zobaczysz w raporcie diagnostycznym PageSpeed Insights.
1. Zasoby blokujące renderowanie
Dzieje się tak, gdy pliki JavaScript lub CSS całkowicie blokują ładowanie strony. Przeglądarka musi się zatrzymać, pobrać plik i go przeanalizować, zanim będzie mogła cokolwiek pokazać użytkownikowi.Jak naprawić:powinieneś odroczyć lub asynchronicznie załadować cały niekrytyczny kod JavaScript. W przypadku CSS wyodrębnij krytyczny kod CSS i wstaw go do celu, a następnie załaduj resztę asynchronicznie.
2. Niezoptymalizowane ogromne obrazy
Obrazy stanowią zazwyczaj największą część całkowitej wagi strony internetowej. Przesłanie obrazu o rozmiarze 5 MB dla małego logo to gwarantowany sposób na spowolnienie wszystkiego.Jak naprawić: zawsze kompresuj swoje obrazy, korzystając z nowoczesnych formatów, takich jak WebP. Powinieneś również użyćloading="lazy"atrybut, dzięki czemu obrazy poniżej zagięcia są ładowane tylko wtedy, gdy użytkownik przewinie do nich w dół. Zawsze ustawiaj wyraźną szerokość i wysokość znaczników obrazu, aby zapobiec zmianom układu.
3. Zbyt dużo nieużywanego JavaScriptu
Współczesne strony internetowe często ładują duże biblioteki lub skrypty stron trzecich, ale wykorzystują tylko niewielką część kodu. Przeglądarka nadal musi wszystko pobrać i ocenić, co zajmuje cenny czas przetwarzania.Jak naprawić: usuń nieużywane wtyczki i spróbuj podzielić kod. Ładuj tylko skrypty, których faktycznie potrzebujesz, na tej konkretnej stronie.
4. Powolne czasy reakcji serwera
Czas do pierwszego bajtu (TTFB) mierzy, ile czasu zajmuje serwerowi hostingowemu zwrócenie początkowego kodu HTML. Jeśli Twój serwer jest powolny, wszystkie inne optymalizacje nie będą miały większego znaczenia.Jak naprawić: użyj szybkiego hosta internetowego. Zaimplementuj buforowanie po stronie serwera i użyj sieci dostarczania treści (CDN), aby obsługiwać swoją witrynę z serwerów fizycznie bliższych użytkownikom.
To narzędzie jest świetne, ponieważ pokazuje dokładnie, gdzie popełniłeś błąd, a nawet pokazuje dokładne zrzuty ekranu. Wystarczy więc naprawić te błędy krok po kroku, a Twoje SEO ulegnie poprawie.
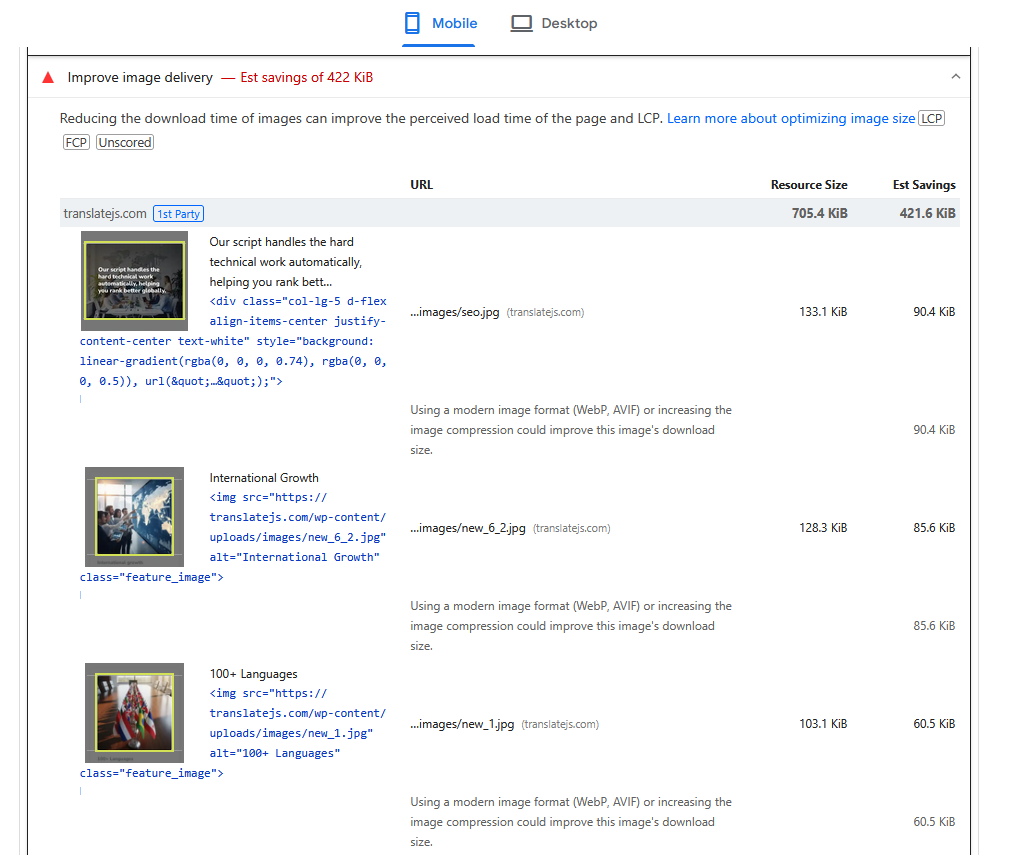
Zasugerowano na przykład konwersję obrazów .jpg na obrazy .webp dla naszej witryny.
Alenie denerwuj się, jeśli nie możesz osiągnąć 100%, tak naprawdę jest to naprawdę trudne do zrobienia. Jeśli Twoja witryna jest złożona, potrzebujesz dużo obrazów, kilku konkretnych bibliotek js, możesz pomyśleć – nie ma już nic do optymalizacji, dlaczego mój wynik nadal wynosi 80-90%? To jest absolutnie normalne. Jeśli Twoja strona internetowa znajduje się w “zielonej strefie”, to już jest dobry znak. Co więcej, wyniki mogą się nawet różnić o kilka punktów procentowych –bez żadnych zmian–, jeśli przetestujesz prędkość w innym czasie.
Nadal jednak powinieneś starać się maksymalizować swoją wydajność, przeglądając i naprawiając każdy błąd na liście.
Dlaczego nasz skrypt tłumaczeniowy utrzymuje Twoją prędkość na wysokim poziomie
Dodając nowe widżety do swojej witryny, musisz bardzo uważać na wydajność. Bardzo często zdarza się, że wtyczki tłumaczeniowe niszczą wynik PageSpeed. Często ładują ogromne bazy danych językowych po stronie klienta, uruchamiają duże opóźnienia JavaScript i blokują renderowanie, podczas gdy zastanawiają się, jaki język wyświetlić.
Nasz scenariusz tłumaczenia stworzyliśmy wyłącznie z myślą o wydajności. Oto dlaczego nasze rozwiązanie jest lekkie i ma minimalny wpływ na szybkość działania:
- Mały limit ładunku:nasz główny skrypt jest niesamowicie mały. Nie łączymy dużych bibliotek stron trzecich. Dodaje zaledwie kilka kilobajtów do rozmiaru Twojej strony.
- Ładowanie asynchroniczne:skrypt jest zaprojektowany tak, aby działał asynchronicznie. Nigdy nie blokuje renderowania głównej zawartości.
- Globalna dostawa CDN:dostarczamy skrypt i przetłumaczony tekst z globalnej sieci. Oznacza to, że dane pokonują możliwie najkrótszą odległość do odwiedzającego.
- Natywny wtrysk DOM: zamiast ukrywać stronę lub tworzyć zmiany układu, nasz skrypt natywnie i bezproblemowo wstrzykuje przetłumaczone ciągi znaków. Wykonuje się w milisekundach, więc skumulowane przesunięcie układu pozostaje idealnie na poziomie zera.
Dzięki temu, że zasięg techniczny jest jak najmniejszy, mamy pewność, że możesz w całości przetłumaczyć swoją witrynę, nie rezygnując przy tym z ciężko wypracowanych rankingów SEO ani doświadczenia użytkownika.
Uczyń swoją witrynę wielojęzyczną
Przełam bariery językowe i dotrzyj do odbiorców na całym świecie. Zwiększ zasięg, rozwiń firmę i działaj globalnie już dziś.
Nie jest wymagana karta kredytowa